The point
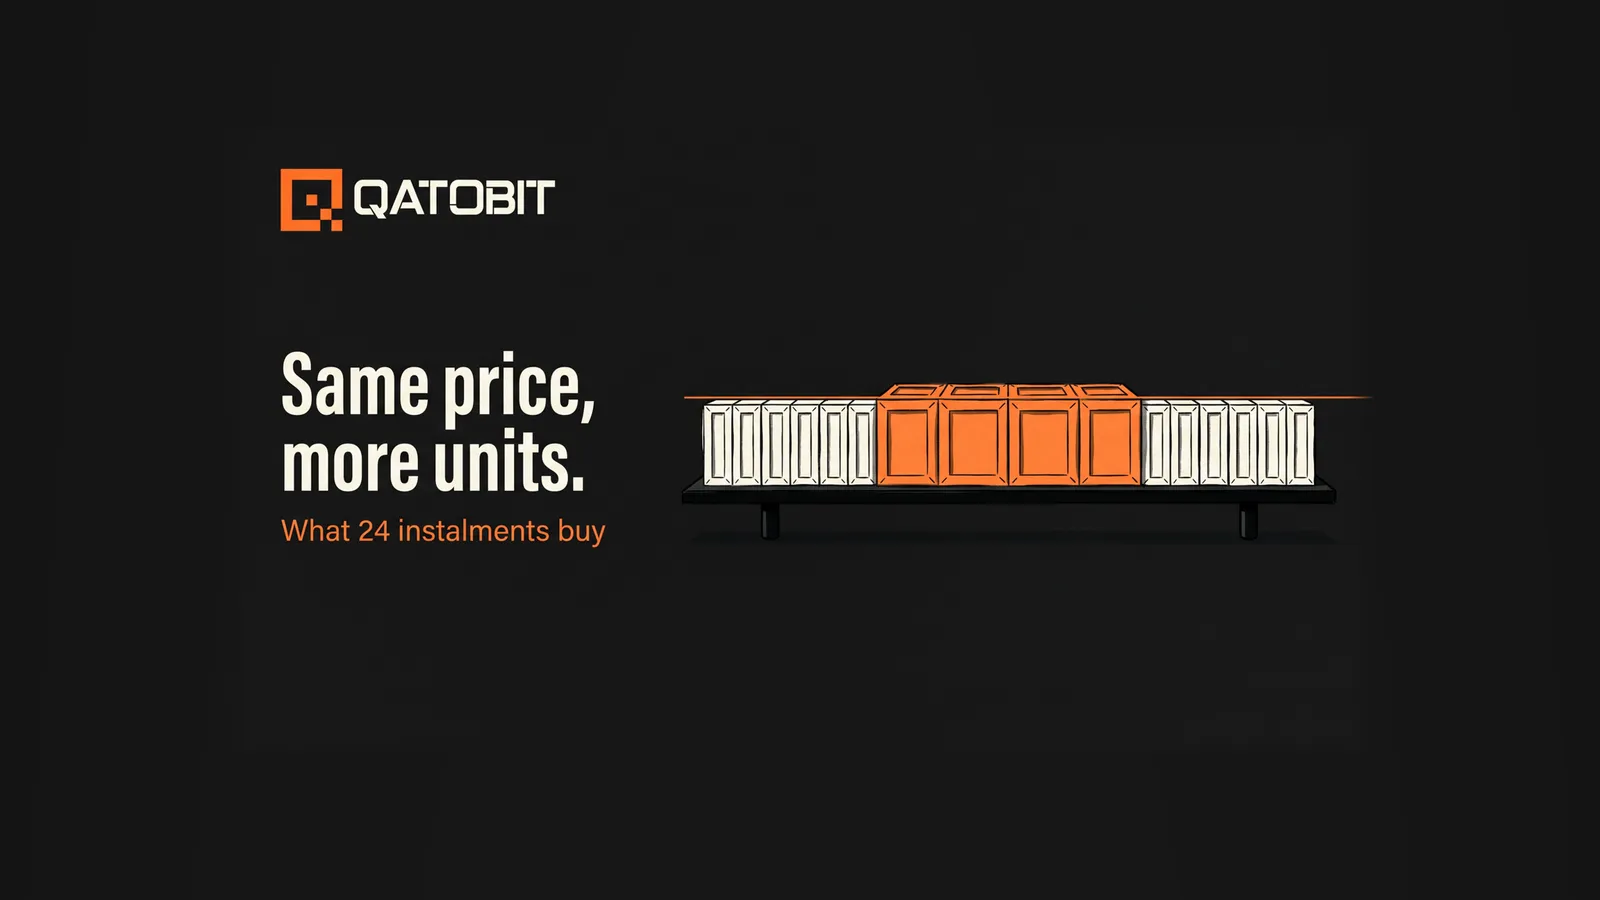
A SIP return cannot be read off one start price and one end price, because every instalment buys at its own price and is held for its own time. In the worked example below, 24 instalments of ₹25,000 end with the unit price exactly where it started, and the SIP still shows a gain of ₹50,000 on ₹6,00,000 invested. The reason is the unit count.
Why does a flat price not mean a flat SIP?
A SIP is a series of separate purchases, so there is no single start price. Each instalment buys units at whatever the price is on its date, and the price you paid on the first day describes only the first instalment.
Take a plain lump sum first. ₹6,00,000 invested at ₹100 a unit buys 6,000 units. If the price is ₹100 again two years later, the holding is worth ₹6,00,000 and the gain is zero.
A SIP over the same two years is a different object. The price you compare against is the average of the prices you paid, weighted by how many units each instalment bought. When the price dips in the middle, the instalments made during the dip buy more units, and those units are still there when the price recovers.
Business Today's report on the CRISP scorecard states the mechanism. When markets stay weak, fixed monthly contributions buy more units at lower prices. It is arithmetic on unit counts, and it forecasts nothing about where a price goes next.
What does a worked schedule of 24 instalments look like?
The prices below are made up for illustration. They are not a forecast and not a record of any asset.
Suppose you invest ₹25,000 on the same date each month for 24 months. The unit price is ₹100 for the first eight instalments, ₹80 for the next eight, and ₹100 for the last eight.
- Instalments 1 to 8: ₹25,000 × 8 = ₹2,00,000 at ₹100 a unit buys 2,000 units.
- Instalments 9 to 16: ₹2,00,000 at ₹80 a unit buys 2,500 units.
- Instalments 17 to 24: ₹2,00,000 at ₹100 a unit buys 2,000 units.
Total invested is ₹6,00,000 and total units are 2,000 + 2,500 + 2,000 = 6,500. The average cost per unit is ₹6,00,000 ÷ 6,500 = ₹92.31, which is below the ₹100 the price shows at the end.
At ₹100 a unit the 6,500 units are worth ₹6,50,000. The gain is ₹50,000, which is 8.33 percent of the ₹6,00,000 put in.
The price at the start was ₹100 and the price at the end is ₹100. The statement still shows a gain, because the middle eight instalments bought 500 more units than a ₹100 price would have given.
How is a SIP return actually measured?
There are two common measures, and they answer different questions. Absolute return is the gain divided by the total invested. In the example it is ₹50,000 ÷ ₹6,00,000 = 8.33 percent, a figure that says nothing about how long the money was in.
XIRR is the annual rate that makes the dated cash flows add up. Microsoft's documentation describes XIRR as the internal rate of return for cash flows that are not necessarily periodic. Each flow is discounted on a 365-day year. Every instalment has its own date, so each is weighted by how long it has been invested.
On the example, treating the last valuation as one month after the final instalment, XIRR comes to about 7.9 percent a year. That sits a little below the 8.33 percent absolute figure, because most of the money was invested for less than the full two years.
A statement that shows only absolute return makes a SIP look better or worse than its annual rate depending on how long the instalments were held. XIRR corrects for that. When you read a SIP figure, check which of the two it is.
Why does every instalment have its own holding period?
The first instalment in the example has been invested for 24 months. The last has been invested for one. The average instalment has been invested for roughly 12 to 13 months, so a SIP that has run for two years carries about a year of average exposure.
That has a practical consequence. A statement that says "two years" describes the SIP's age. Most of the money is younger than the SIP, so a gain or a loss on it reflects a shorter and more recent stretch of prices than the label implies.
It also explains why a SIP's return moves more slowly at the start than a lump sum's would. Early on, the units bought are few and the holding periods are short, so the figure on screen is built from very little history.
What does the schedule do if the price ends lower?
The same 24 instalments, with the price ending at ₹90 instead of ₹100, still buy 6,500 units. The holding is worth 6,500 × ₹90 = ₹5,85,000, which is ₹15,000 below the ₹6,00,000 invested, a loss of 2.5 percent.
The price finished 10 percent below its starting level, and the SIP is down 2.5 percent. A lump sum of ₹6,00,000 at ₹100 would be worth ₹5,40,000 at ₹90, down 10 percent. The SIP's smaller loss comes from the lower average cost of ₹92.31.
The schedule does not remove the risk. At an end price of ₹80, the same 6,500 units are worth ₹5,20,000, a loss of ₹80,000. The units bought in the dip help, and they do not rescue a price that never recovers.
Our view is that this is the most useful way to read a flat or falling stretch. The value on screen tells you where the price is. The unit count tells you what the schedule has done in the meantime, and the two numbers can point in different directions.
What does this mean for a SIP in crypto?
A Crypto SIP at Qatobit runs on the same instalment arithmetic. You set an amount, choose weekly, biweekly or monthly, pick an asset or an index, and the platform invests on that schedule from your INR balance. The cadence changes how many dated purchases there are, and the method stays the same.
A Bitcoin SIP buys one coin at each date's price. A SIP into an index spreads each cycle across the whole basket on the published methodology, which is the version the site leads with. In both cases the units you hold and the average price you paid come from the schedule of instalments, as in the example above.
Market risk remains. A schedule gives you a lower average cost in a falling market and a higher one in a rising market, and it does not pick the end price. The discipline it gives you is a rule set before the price moves, which is the point of a systematic plan.
If you already invest on a schedule, you can invest in QSI Growth or start a Bitcoin SIP on the same footing. For the question of whether to spread entry at all, see SIP versus lump sum. For why the time in the schedule matters more than the rate, see what compounding is.
Frequently asked questions
How are SIP returns calculated?
A SIP return is measured on the dated instalments, not on one start price. Absolute return is the gain divided by the total invested, and XIRR is the annual rate that matches the dated cash flows. In the worked example, ₹50,000 on ₹6,00,000 is 8.33 percent absolute and about 7.9 percent a year as XIRR.
What is the difference between absolute return and XIRR?
Absolute return ignores how long each instalment was invested. XIRR weights each dated instalment by its holding time and gives an annual rate. For a SIP, XIRR is the fairer figure, because the instalments have different ages.
Can a SIP show a gain when the price is flat?
Yes. If the price dips between instalments, those instalments buy more units. In the example, a price of ₹100 at the start and the end gives 6,500 units at an average cost of ₹92.31, a gain of ₹50,000 on ₹6,00,000.
Why does a SIP's age not match its money's age?
Each instalment is invested from its own date. The first instalment in a 24-month SIP has been invested for 24 months, and the last for one, so the average instalment is only about a year old.
Does a SIP remove the risk of a falling price?
No. A SIP lowers the average cost when the price falls. If the price keeps falling, the holding is still worth less than was invested. In the example, an end price of ₹80 leaves 6,500 units worth ₹5,20,000 against ₹6,00,000 invested.
Crypto investments are subject to market risk. Not financial advice.
“A better allocation begins with a better explanation.”
Qatobit principle
Published construction. Fixed cadence. Versioned control.