The point
A drawdown is the fall from a peak to the lowest point reached after it, measured as a percentage of that peak. The maximum drawdown is the single largest such fall over a chosen window. Neither number says where a price is going next. Both describe what a holder actually lived through on the way down, which is a different question, and the one a position size has to answer.
How a drawdown is measured
Take any drawdown: an index sits at a peak of 1,000. It falls to 850. The fall is 150 points on a peak of 1,000, so the drawdown is 15 percent. If the index later falls further to 700 before recovering, that 700 becomes the new trough. The fall from 1,000 is then 300 points. So 30 percent is the maximum drawdown for that window, and the earlier 15 percent was only a marker passed on the way down. The number resets only once a new peak is set. A recovery to 900 does not end the drawdown; the drawdown ends only when the index closes above its old peak of 1,000 again.
This is arithmetic on a price series, nothing more. It needs a peak, a trough after that peak, and the percentage between them. Nothing about the calculation forecasts the next move.
The recovery arithmetic
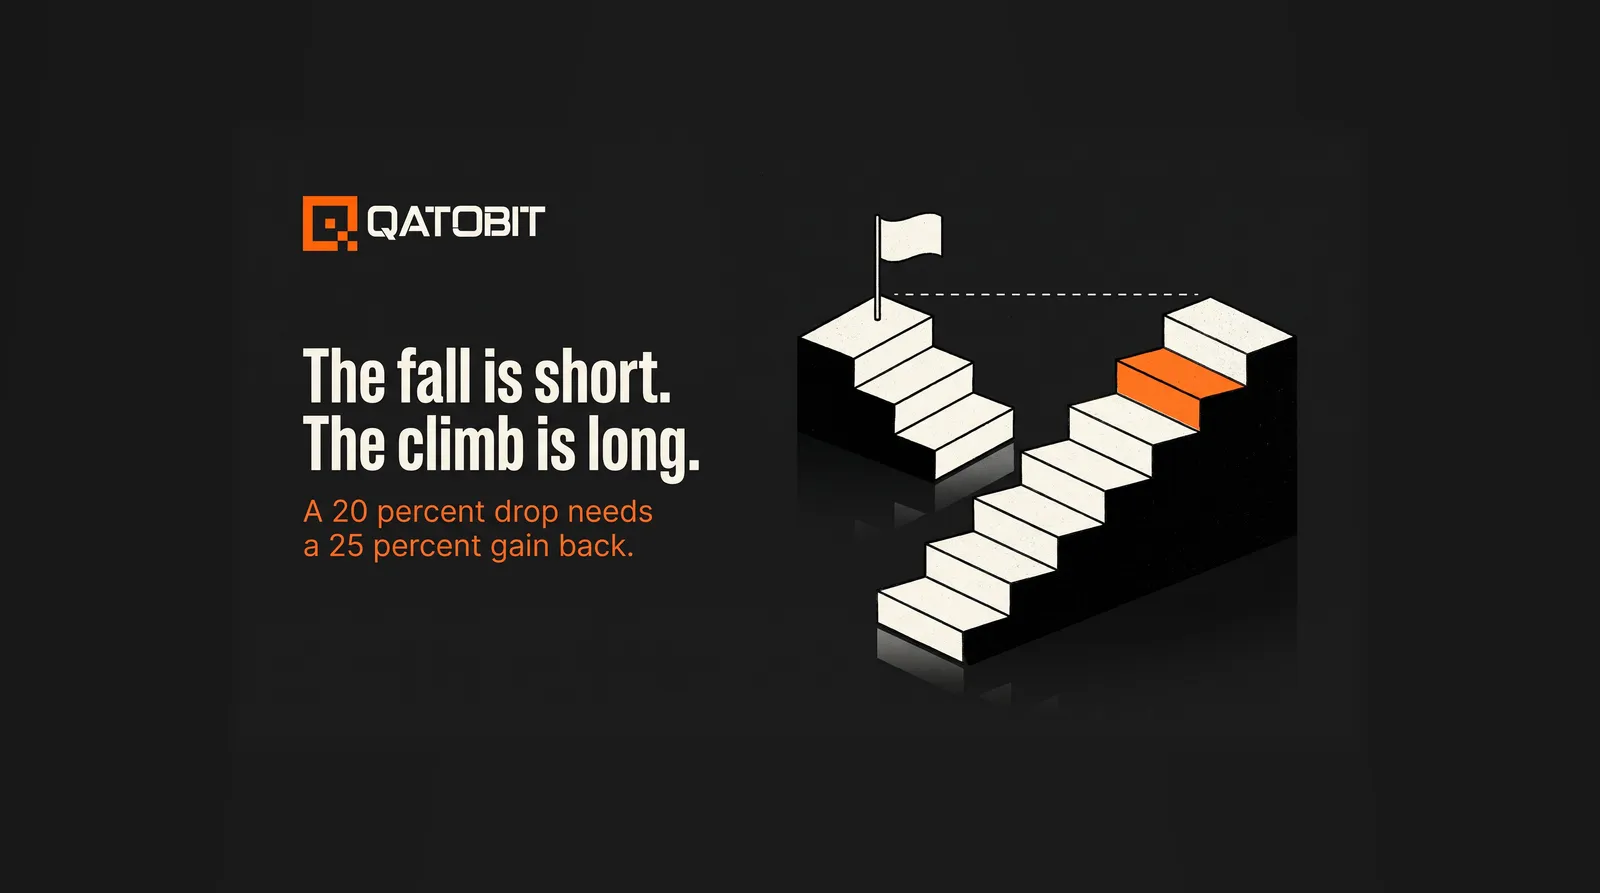
A fall and the gain needed to undo it are not the same size, and the gap widens as the fall gets bigger. A 10 percent fall needs an 11.1 percent gain to get back to the old peak, because the recovery is measured on a smaller base. A 20 percent fall needs a 25 percent gain. A 30 percent fall needs a 42.9 percent gain. A 50 percent fall needs a full 100 percent gain, doubling from the trough just to stand still. A 70 percent fall needs 233 percent.
The pattern is one division: the gain required equals the fall divided by (1 minus the fall), both written as decimals. A 0.20 fall divided by 0.80 remaining gives 0.25, the 25 percent above. The deeper the fall, the faster the required gain outruns it, which is the entire reason a drawdown is worth sizing against before it happens rather than budgeting for after.
Drawdown versus volatility
The two measure different things, and a low reading on one says nothing about the other. Volatility is a dispersion, how much a price swings around its average over some period, up and down both counted the same way. A drawdown is a path, the specific distance from one peak down to the trough that followed it, direction fixed.
An asset can carry high daily volatility and a short, shallow drawdown, if the swings net out and a new high arrives quickly. Another asset can look calm day to day, low volatility readings throughout, and still carry a long, deep drawdown. It only needs to drift down slowly and take months to make a new high. "It doesn't feel volatile" and "it hasn't cost me anything" are separate claims, and each needs checking on its own terms. A position sized only against day-to-day swings can still be sitting through a drawdown a volatility gauge never flagged.
How a drawdown limit is written down in advance
A drawdown limit is two numbers fixed before a position exists. One is a percentage of the total portfolio allocated to a given sleeve. The other is the percentage fall inside that sleeve the investor is willing to sit through without changing the plan. Written down, both numbers turn an abstract risk into a rupee figure that can be checked against the actual account.
Take a ₹1 crore portfolio with a 20 percent allocation to a crypto sleeve, so ₹20 lakh is at work in it. A 15 percent fall inside that sleeve is ₹3 lakh, which is 3 percent of the whole ₹1 crore portfolio. That 3 percent is the number the limit is actually about. It describes what the investor's total wealth absorbs if the fall happens; the 15 percent only describes the sleeve on its own. A limit written this way answers a concrete question before the fall arrives. Does 3 percent of the whole portfolio, gone for a period of unknown length, change what this investor does next? If the honest answer is yes, the allocation was sized too large before a single rupee moved. The fix in that case is the allocation itself, decided again before the next rupee goes in.
What a multi-week decline tests
A drawdown limit is tested by time. Conviction has nothing to do with whether it holds. The Nifty 50 closed the week ended 25 September 2026 at 23,140.50, down 0.9 percent for the week. That was its seventh consecutive weekly decline, the longest run of weekly losses since the COVID-19 selloff in 2020 (5paisa, 25 September; Upstox, 26 September). Seven weeks of falls in a row is a different animal from a single bad session an investor can wait out on nerve. That is exactly the stretch a drawdown limit exists to answer for, in rupees, before it happens. A limit exists to be checked against a week like that. The week itself does not get a vote on what the limit says.
How a rule uses the number
The sizing decision is made once, before the position, and a rebalance calendar is what keeps it from drifting on its own. Qatobit's QSI indices rebalance monthly on a documented methodology, and each rebalance resets the index's own weights on the same schedule every time. A holding is never left to run its own drawdown indefinitely between one rebalance and the next. That is a structural fact about how the product works. It says nothing about what the product returns; the rebalance keeps to the calendar whether the month was up or down.
None of this is a comparison of returns, and it is not a forecast for the Nifty, for crypto or for anything else. A drawdown limit does not predict when a fall ends. It only fixes, in advance, how much of a portfolio is allowed to be affected while one runs.
A seven-week decline is worth separating from a single bad week; what a bear market is, and what one bad week is not covers that distinction. A low reading on the market's own volatility gauge is a different signal from a shallow drawdown. What India VIX measures, and how to read a low print covers why. How much of a portfolio a crypto sleeve should hold in the first place is a separate question, before any drawdown limit gets written. How much of my portfolio should be in crypto covers it. And what is a crypto index covers the mechanic behind the rebalance calendar described above.
Frequently asked questions
What is a drawdown?
A drawdown is the percentage fall from a price series' peak to the lowest point reached after that peak. It is measured after the fact, on a completed price path, and it says nothing about future direction.
What is a maximum drawdown?
The maximum drawdown is the single largest peak-to-trough fall within a chosen window of time. A series can carry several smaller drawdowns inside that window; only the deepest one is the maximum.
How is drawdown calculated?
Take the peak value, subtract the trough value that follows it, and divide by the peak. A peak of 1,000 falling to a trough of 800 gives (1,000 minus 800) divided by 1,000, a 20 percent drawdown.
What is a good maximum drawdown?
There is no fixed good number. There is only the limit an investor wrote down before the position existed, sized as a percentage of the total portfolio they are willing to see affected. A drawdown that stays inside that written limit did its job. One that does not is a signal to revisit the allocation.
Does a drawdown apply to a crypto index?
Yes. A crypto index's value can fall from a peak the same way any priced asset can, and the same peak-to-trough arithmetic applies to it. A rebalance on a fixed monthly schedule is a structural feature of how the index is maintained; it does not exempt the index from having a drawdown.
Crypto investments are subject to market risk. Not financial advice.
“A better allocation begins with a better explanation.”
Qatobit principle
Published construction. Fixed cadence. Versioned control.