The point
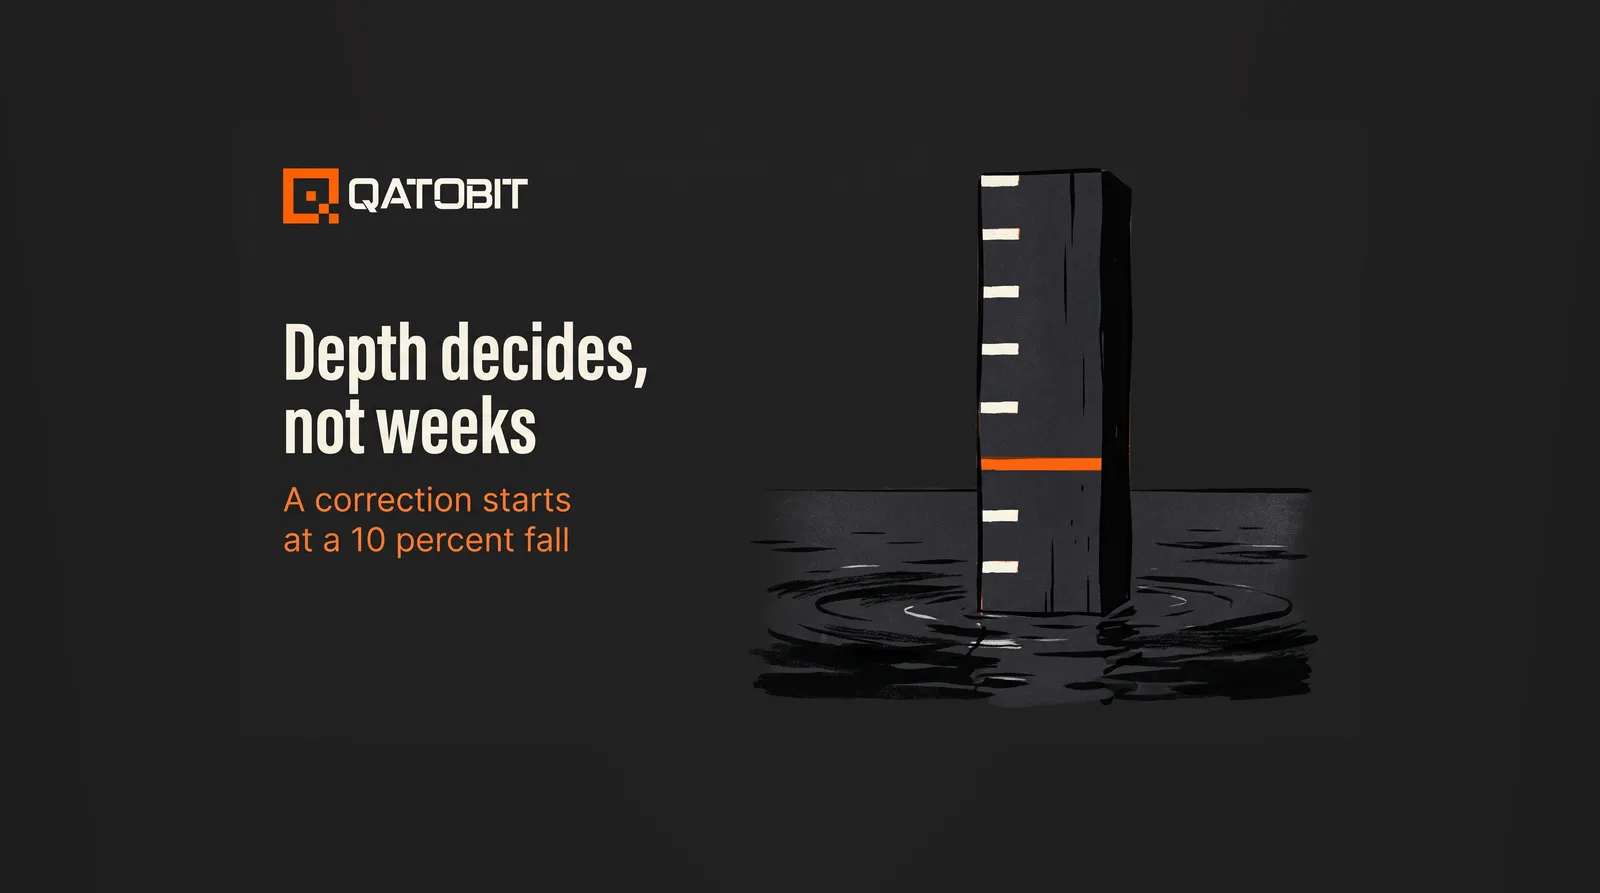
A market correction is a fall of more than 10 percent from a recent high, and a losing streak only counts the weeks. Outlook Money reported on 30 September 2026 that the Nifty 50 was on course for its eighth straight weekly fall, with the index down about 8 percent across the run. A long streak and a deep fall are two separate facts. A holder acts on the depth.
What is a market correction?
A stock market correction is typically defined as a drop of more than 10 percent in the value of an index, measured from a recent high to the lowest close. A fall of more than 20 percent that is sustained is usually called a bear market.
Source: Wikipedia, Market correction, read 2026-10-06.
https://en.wikipedia.org/wiki/Market_correction
The 10 percent line is a convention that nobody certifies and no exchange announces. It exists so that people can say how far a market has fallen without arguing about the word "crash".
By this convention a fall of about 8 percent is not yet a correction. Eight red weeks in a row can still sit below the line.
Why does a long streak feel worse than the fall?
Because a streak is a count of disappointments, and a count is easy to see. Eight weekly closes lower than the one before feels like eight separate verdicts.
Outlook Money makes the same point in its own words. A losing streak measures the number of weeks the market has fallen, not the extent of the decline.
Source: Outlook Money, read 2026-10-06.
https://www.outlookmoney.com/invest/nifty-eighth-consecutive-weekly-fall-longest-losing-streak-25-years-october-outlook
The same article gives the depth of earlier runs. The seven-week streak that ended on 21 September 2001 erased 20.50 percent from the Nifty. The one that ended on 4 July 2008 erased 22.1 percent. The one that ended on 3 April 2020 erased 33.30 percent. The nine-week run that ended on 13 April 2001 took 27.10 percent, and the ten-week run that ended on 23 April 1993 took 22.90 percent.
The run Outlook Money was describing had fallen 5.82 percent over its first seven weeks, and about 8 percent including the week still in progress on 30 September 2026. That is a long streak and a shallow fall. Each of the three seven-week runs fell by 20.50 percent or more, so a streak of this length has not always meant a shallow fall.
What does a fall cost a holder, in rupees?
A percentage becomes a decision only when it is turned into rupees. Take a ₹1 crore portfolio with ₹40 lakh in Indian large-cap stocks that move with the Nifty 50.
A fall of 8 percent on that ₹40 lakh is ₹3.2 lakh, which is 3.2 percent of the whole portfolio. A fall of 20.50 percent is ₹8.2 lakh, or 8.2 percent of the portfolio. A fall of 33.30 percent is ₹13.32 lakh, or 13.3 percent of the portfolio.
The same arithmetic runs in reverse, and it is less kind. After a fall of 8 percent, ₹100 has become ₹92, and getting back to ₹100 takes a rise of 8.70 percent (100 ÷ 92 = 1.087). After a fall of 20.50 percent, a rise of 25.8 percent is needed (100 ÷ 79.5 = 1.258). After a fall of 33.30 percent, the rise needed is 50 percent (100 ÷ 66.7 = 1.499).
This is arithmetic about how percentages work, and it carries no view on whether or when any market will make that rise.
Why is a fall the price of holding the asset?
An asset whose value can rise over years is an asset whose value can also fall in between. The rise and the fall come in one package.
A holder who wants the rise has already agreed to sit through the fall, whether or not they said so.
So the useful question is how big a fall your plan can take, and for how long, before the money's job is put at risk. A fall that stays inside that answer is the cost of holding. A fall that goes past it means the plan was sized wrong, which a sale after the fact does not fix.
Why does selling after a streak make the loss real?
A paper loss is a number on a screen that can still change. A sale fixes it.
Go back to the ₹40 lakh holding after a fall of 8 percent. It is worth ₹36.8 lakh. Selling at that price turns a paper loss of ₹3.2 lakh into a real one of ₹3.2 lakh, and leaves the holder with no position if the price turns.
Getting back in raises a second problem. To re-buy at a lower price than the sale price, the holder has to be right about the timing a second time. To re-buy at a higher price, the sale cost the difference. So a sale made out of caution carries two chances to be wrong.
The case for selling is a different thing: the money is needed sooner than the plan assumed. That is a change in the money's job, and it is a good reason, which a streak on a chart never is.
What decides whether you can sit through one?
The horizon and the drawdown you can live through, and you set both.
The horizon is when the money will be spent. Money needed in eighteen months for a known liability is exposed to a fall in a way that money with ten years ahead of it is not. The two are different jobs and are usually held separately.
The drawdown you can live through is a rupee figure written before the fall. A drawdown is the fall from a peak to a low, measured in the portfolio's own value. "I can take a fall of ₹10 lakh on this sleeve, for up to two years, without selling" is a limit. "I can take volatility" is a mood.
The money's job sets the horizon, as laid out in what an investment objective is and how it decides an allocation. A feeling becomes a figure in what risk appetite means and how to measure yours in rupees. Position size follows in what a drawdown is and how a position is sized to survive one.
What does a rule written in advance do during a correction?
It moves the decision to a day when the fall has not happened. On the day of the fall, the only question left is whether the fall has crossed the line you drew.
My view: watch the figure you wrote down before the first red week, and ignore how many red weeks have followed.
Qatobit's indexes work from the same idea in crypto. Rules decide the basket, a schedule carries the rebalance, and nothing is left to a mood. A QSI index is rebalanced monthly, on a published methodology, whatever the recent run of prices looked like.
The investor's part is the same one described above. Choose the thesis that fits the horizon and the limit, and invest in it on purpose.
What a long streak asks of a holder
A long streak asks one thing: that you check the depth against your own limit and ignore the count. If the fall is inside the limit, the plan is working as designed. If it has crossed the limit, the sizing was the error and it can be corrected at the next allocation decision.
The next question in the cluster follows from this one. Once you know the limit, how large should the position be so that the limit holds?
Frequently asked questions
What is a market correction?
A market correction is typically a fall of more than 10 percent in an index, measured from a recent high to its lowest close. A sustained fall of more than 20 percent is usually called a bear market.
Is an eight-week losing streak a correction?
Not by the 10 percent convention. Outlook Money reported on 30 September 2026 that the Nifty 50 was heading for an eighth straight weekly fall. The cumulative decline was about 8 percent, below the 10 percent line.
How long does a market correction last?
There is no fixed length. By the usual definition a correction ends once the index reaches a new high, and the time that takes differs each time.
Should I sell during a market correction?
A fall alone is not a reason to sell or to hold. The question is whether the fall has crossed the limit you wrote down for that money, and whether the money's job has changed.
How do I decide how big a fall I can sit through?
Write it as a rupee figure and a duration before any fall. For example, a fall of 20 percent on ₹40 lakh is ₹8 lakh. The limit is whether you could leave that ₹8 lakh untouched for as long as the plan needs.
Crypto investments are subject to market risk. Not financial advice.
“A better allocation begins with a better explanation.”
Qatobit principle
Published construction. Fixed cadence. Versioned control.