The point
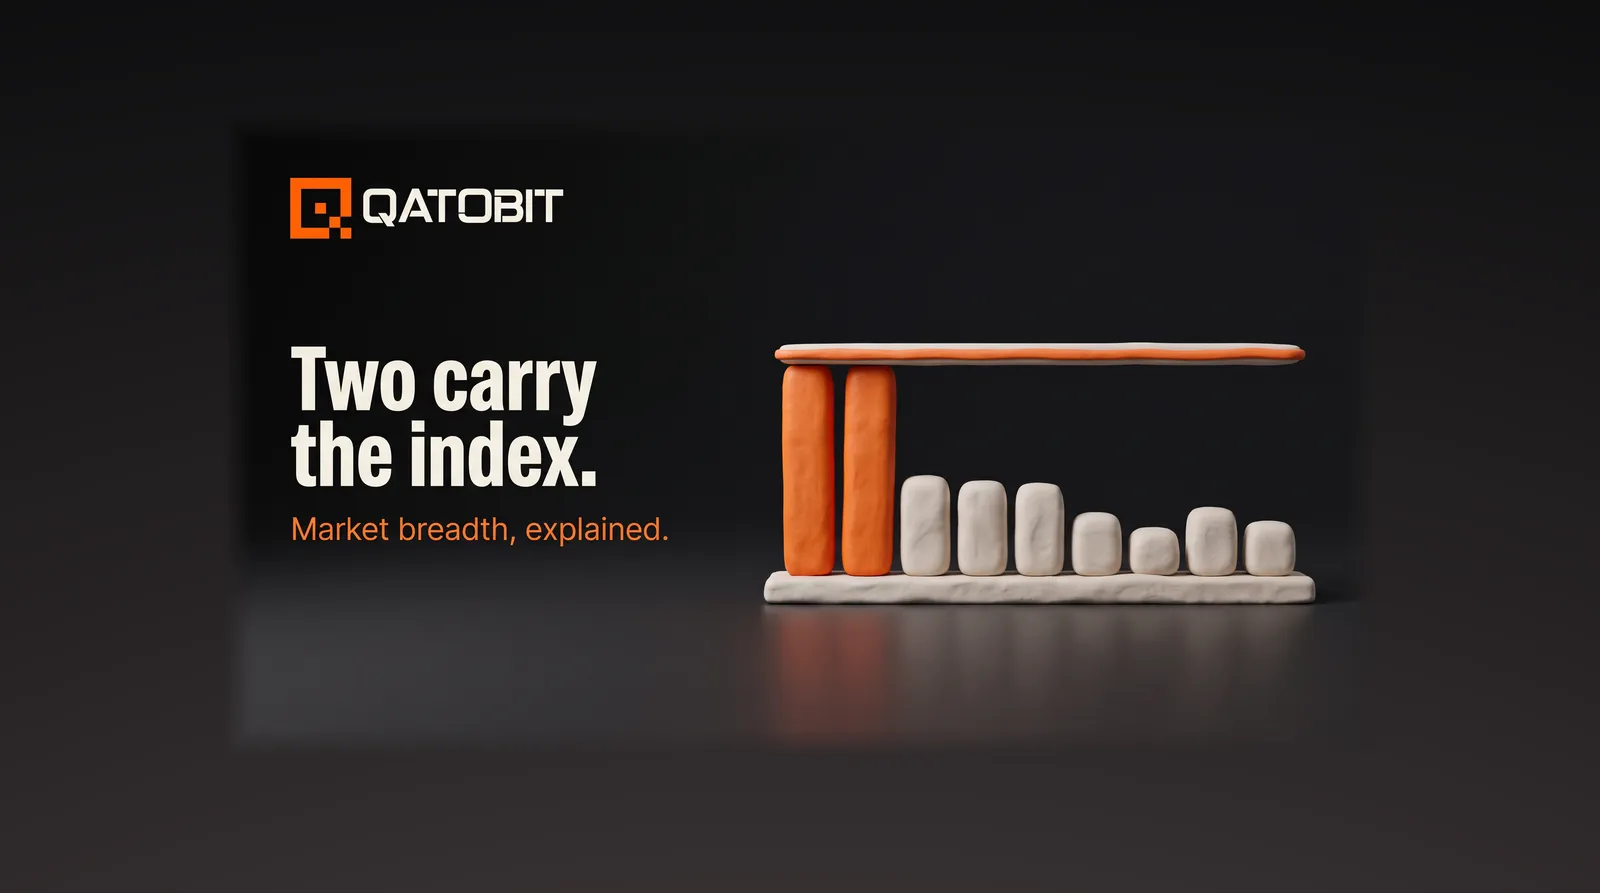
Market breadth counts how many stocks share a move, and the simplest version is the advance-decline ratio: 600 stocks up against 400 down gives 1.5. An index weighted by company size can hold steady while most of its members fall, because a few heavy names carry the number. Breadth shows how many stocks sit behind the index level.
What does market breadth measure?
Market breadth measures participation: how many stocks are moving with an index, rather than how far the index moved. The index gives one number. Breadth asks how many of the stocks under that number agree with it.
There are three common ways to count. Each answers the same question with a different ruler.
The advance-decline ratio
The advance-decline ratio, or ADR, divides the number of stocks that rose in a session by the number that fell. Kotak Neo's worked example: if 600 of 1,000 traded NSE stocks advanced and 400 declined, ADR is 600 ÷ 400 = 1.5. Above 1 means more stocks rose than fell. Below 1 means the reverse. Kotak Neo treats a reading above 2 or below 0.5 as an extreme (source: Kotak Neo).
The share of stocks above a moving average
A 50-day simple moving average is the average of a stock's last 50 closing prices. Count how many stocks in an index trade above their own 50-day average, and the share becomes a breadth reading with a longer memory than one session.
The share of stocks far below their high
A third count asks how many stocks sit a set distance under their own highest price, say 20 or 30 percent. It is slower than the first two and harder to dismiss, because a fall of 30 percent takes a long stretch of sessions to build.
How can an index rise while most of its stocks fall?
An index weighted by company size moves mostly with its largest members, so a handful of heavy stocks can lift it while most of the list declines. Kotak Neo names the effect directly: huge companies "may be lifting the index, even when the overall market is weak" (source: Kotak Neo).
Take a made-up index of ten companies. It is an illustration, not a live figure, and none of the ten is a real company.
Company A carries 30 percent of the index and company B carries 20 percent. The other eight carry 6.25 percent each, which is 50 percent between them. Suppose A and B each rise 8 percent and the other eight each fall 7 percent.
The index move is the sum of each weight times each move.
- A: 30% × 8% = +2.4 points
- B: 20% × 8% = +1.6 points
- The eight others: 50% × (−7%) = −3.5 points
Net: 2.4 + 1.6 − 3.5 = +0.5 percent. The index reads up half a percent. The ADR for the day is 2 advancers to 8 decliners, 2 ÷ 8 = 0.25, below Kotak Neo's 0.5 marker for an extreme. Eight of ten stocks fell and the headline number rose.
Now take a holder with ₹1 crore split evenly, ₹10 lakh in each of the ten. Two positions gain 8 percent, which is ₹80,000 each, ₹1,60,000 together. Eight positions lose 7 percent, which is ₹70,000 each, ₹5,60,000 together. Net: ₹1,60,000 − ₹5,60,000 = −₹4,00,000, a 4 percent fall on ₹1 crore. The index said +0.5 percent. The portfolio lived −4 percent.
The gap is weights. The index weighs A and B at 50 percent between them. The holder weighs them at 20 percent. The same ten stocks produced two different days, because the two rulers measure size differently.
Weighting is the first thing to read about any index. How the Nifty 50 is calculated, and who decides what is in it shows how free-float weights make a few companies large.
What do the Economic Times figures show?
An Economic Times report on the Nifty 50's losing streak, read on 2 October 2026, put the index 15 percent below its all-time high of 26,373, touched in January 2026. The report calls it the longest run of weekly losses in 25 years, eight weeks in a row. On breadth it cites ICICI Securities. Around 81 percent of Nifty 500 stocks were trading below their 50-day simple moving averages (source: The Economic Times via inkl).
Put the two numbers side by side. The index was 15 percent from its high. Of 500 stocks, 81 percent is 0.81 × 500 = 405 below their 50-day averages, and only 95 above. The index number shows one depth, and the count shows how widely that weakness is spread.
The same page links a second report headlined "Nifty 500's hidden bear market: Half the stocks are down over 30% from highs." Only that headline was read for this piece. The 30 percent figure is the Economic Times's own, and the article behind it is not cited here.
What can market breadth not tell you?
Breadth describes the stocks behind a move today and says nothing about what prices do next. A low reading means most stocks are weak. It does not mark a bottom, and a high reading does not promise a further rise. Kotak Neo itself says to read ADR together with price movement and volume to avoid wrong conclusions (source: Kotak Neo).
It also depends on the universe. ADR on the Nifty 50 counts 50 stocks. ADR on all NSE-listed stocks counts well over a thousand, including thinly traded ones that move on small volumes. Two readings from two universes are two different facts.
What check should a holder run on their own portfolio?
The check takes three steps and one spreadsheet column, and it answers whether the index you watch describes the book you hold.
- List every position and its weight. Note the three largest. If three names carry more than half the book, the portfolio has its own narrow breadth, whatever the index says.
- Mark each position as above or below its 50-day average. Divide the count above by the total. Ten positions with four above is 40 percent.
- Work out your portfolio's move and set it beside the index's move. In the example above the portfolio fell 4 percent while the index rose 0.5 percent. A gap that size means the index weights the stocks differently from the way you do, and it is describing someone else's book.
How a QSI basket sets its weights
A basket is a set of assets held together under one rule. A Crypto Index is a curated basket of digital assets, weighted on a methodology and rebalanced on a schedule. Qatobit offers four QSI Crypto Indices: QSI Core, QSI Growth, QSI VRION and QSI GEQ8. Each is designed and rebalanced by Qatobit on an institutional-grade index methodology, with monthly rebalancing and a documented methodology per index.
Index weights are published on the home and index pages, so anyone can work out how much of each asset a given amount buys. Around every rebalance, before it and after it, the investor can see what changed: what was sold and what was bought, and the basket can be looked into. That is the same discipline this piece asks of any index: read the weighting rule before relying on the number. Four crypto indexes, one methodology sets out how the four QSI indices are built.
Where to go next
Weights decide which stocks speak loudest in an index. What market cap is and why a crash erases no money explains the value measure those weights rest on. A holder needs both the index number and the breadth count, read against the book they actually own.
Frequently asked questions
What is market breadth in simple terms?
Market breadth is the count of how many stocks are moving with an index. If 600 of 1,000 NSE stocks rise and 400 fall, the advance-decline ratio is 1.5. It shows how many stocks stand behind an index level.
How do you calculate the advance-decline ratio?
Divide the number of advancing stocks by the number of declining stocks. With 600 advancers and 400 decliners, 600 ÷ 400 = 1.5. A figure below 1 means more stocks fell than rose, per Kotak Neo.
Can an index rise when most stocks fall?
Yes, when the index is weighted by company size. In the ten-company illustration above, two heavy stocks rose 8 percent and eight fell 7 percent, so the index rose 0.5 percent while an equal-weight holder lost 4 percent.
Is market breadth a signal to buy or sell?
No. Breadth describes how many stocks are moving with a trend now and does not say what prices will do next. Kotak Neo advises reading it with price movement and volume.
What does it mean when 81 percent of Nifty 500 stocks trade below their 50-day average?
It means 405 of 500 stocks sit below the average of their last 50 closing prices, per the ICICI Securities figure the Economic Times reported. Only 95 sit above, so weakness is wide and not confined to a few names.
Crypto investments are subject to market risk. Not financial advice.
“A better allocation begins with a better explanation.”
Qatobit principle
Published construction. Fixed cadence. Versioned control.