The point
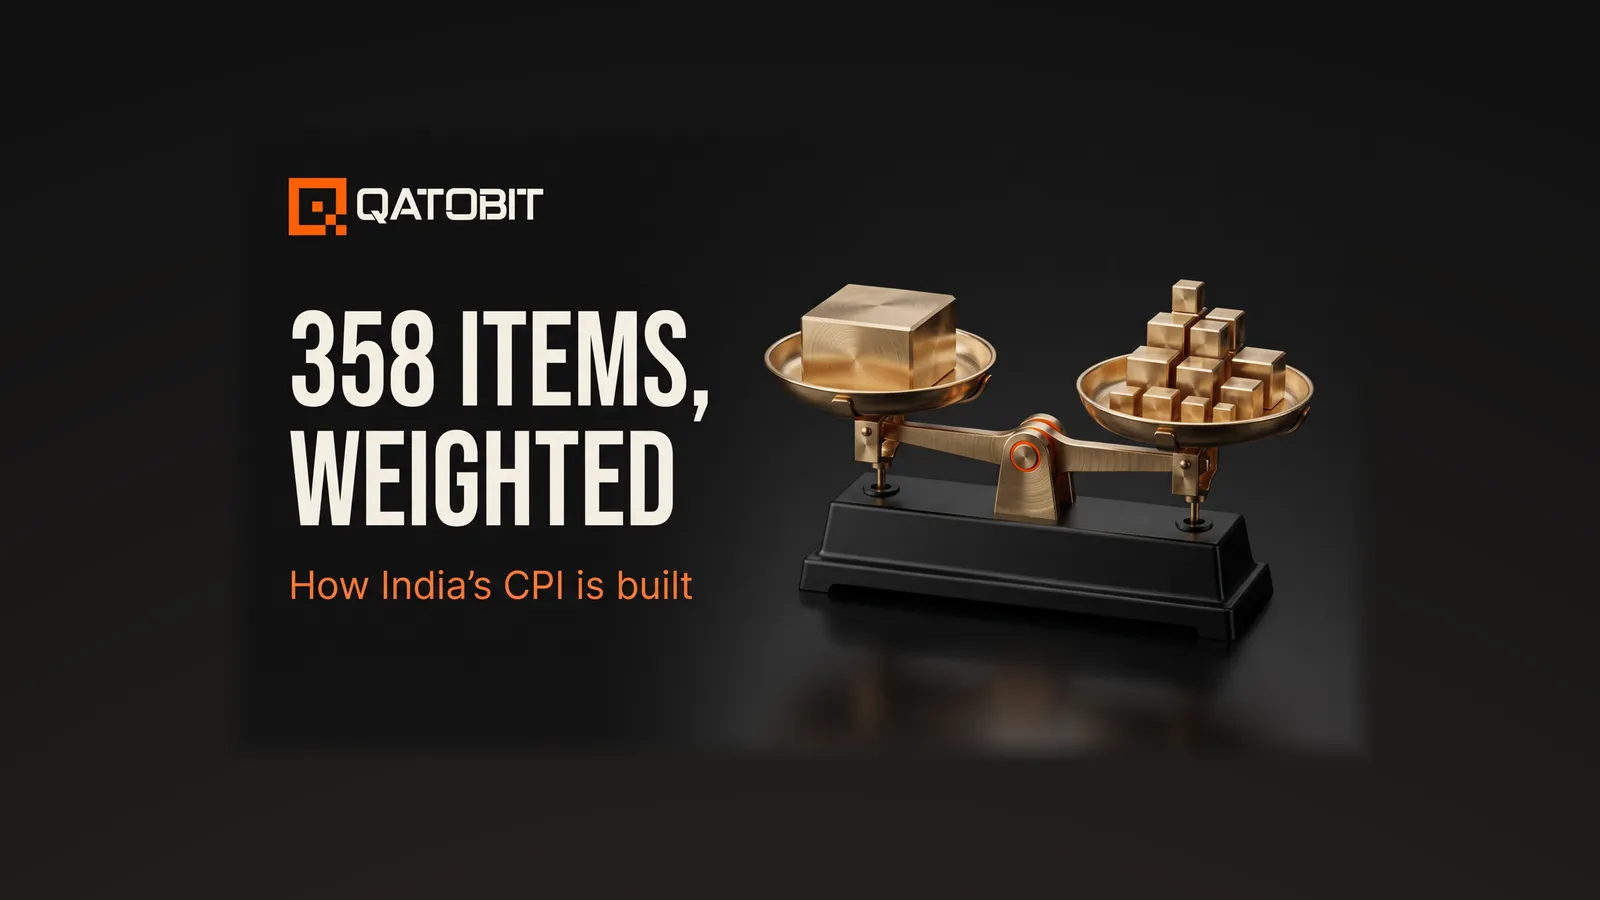
India's CPI inflation is the year-on-year change in a price index. The index tracks a fixed basket of 358 goods and services, each weighted by its share of household spending. The Ministry of Statistics and Programme Implementation (MoSPI) compiles it on a 2024=100 base. For August 2026 the provisional figure was 4.82 percent. A headline number like that is an average of very different movements.
What is in the CPI basket?
The Consumer Price Index (CPI) basket is the list of things a typical household buys, with each item weighted by how much of the household budget it takes. The current series has 358 weighted items, 308 goods and 50 services. They sit in 12 divisions under the UN's COICOP 2018 classification, according to ThePrint's report of the February 2026 launch.
The weights come from the Household Consumption Expenditure Survey 2023-24, not the 2011-12 survey behind the older 2012=100 series. The same report puts food and beverages at 36.75 percent of the basket, down from 45.86 percent, and housing with utilities at 17.67 percent.
Take a household spending ₹1,00,000 a month. On those weights, ₹36,750 of it goes to food and beverages. The remaining ₹63,250 spreads across housing, transport, health, education and the other ten divisions. A price change in rent counts for more than the same change in haircuts because rent takes a bigger share of the budget.
Who collects the prices?
MoSPI's National Statistics Office sends field staff to collect prices. In the August 2026 release, MoSPI states that prices came from 1,407 urban markets, including online markets, and 1,465 villages. Collection runs on a weekly roster, and the response rate was 100 percent that month.
That coverage is why the number is trusted. It is a count of shop-floor prices across the country, gathered the same way every month, and published as a table anyone can download from MoSPI's eSankhyiki portal.
How does a price index turn into a percentage?
An index is a price level set to 100 in the base year. The year-on-year inflation rate is the percentage change in the index against the same month a year earlier.
MoSPI's release gives the combined index for August 2026 as 108.74 and the inflation rate as 4.82 percent. Working backwards, 108.74 divided by 1.0482 gives an implied August 2025 index of about 103.74. The method is the new index divided by the old one, minus one.
The same release gives July 2026 at 107.95 and 4.45 percent, which implies a July 2025 index of about 103.35. Put the two months side by side.
- The index rose from 107.95 to 108.74 between July and August 2026, a monthly gain of about 0.73 percent.
- A year earlier it rose from about 103.35 to about 103.74, a monthly gain of about 0.38 percent.
Year-on-year inflation went from 4.45 to 4.82 percent partly because this August's monthly rise was larger than last August's. That is the base effect: a year-on-year print moves on what the month a year ago did, as well as on what prices did this month. The implied 2025 values are derived from published two-decimal indices, so treat them as rounded.
Source: MoSPI press release on CPI for August 2026, dated 14 September 2026, read for this piece.
Why can the headline hide the real movement?
A headline is a weighted average, so one item can pull it hard in either direction. MoSPI's August 2026 release lists the items with the sharpest moves, with each item's weight.
- Onion carries a weight of 0.7006 and its inflation was 48.27 percent.
- Tomato carries a weight of 0.4961 and its inflation was minus 31.09 percent.
- Gold, diamond and platinum jewellery carries a weight of 0.6230 and its inflation was 35.53 percent.
On a scale where the whole basket is 100, those weights read as ₹700.60, ₹496.10 and ₹623.00 of every ₹1,00,000 of spending. Multiply each by its inflation rate. Onion adds about ₹338 of extra cost (700.60 x 0.4827). Tomato frees up about ₹154 (496.10 x 0.3109). The two items together roughly net out to ₹184 of extra cost on a ₹1,00,000 budget, which is under 0.2 percent of the whole basket.
That is how an item can rise by almost half and barely move the headline, and why a fall in one vegetable does not offset a rise in rent. The weight sets how far each price change travels into the number.
Source: MoSPI press release on CPI for August 2026, read for this piece. The ₹ figures are illustrative arithmetic on the published weights and rates.
Do rural and urban households see the same number?
No, and the release says so every month. The August 2026 combined rate of 4.82 percent splits into 5.23 percent for rural India and 4.31 percent for urban India, a gap of 0.92 percentage points. The headline blends the two in proportion to their consumption shares.
The divisions differ even more. The same release shows food and beverages at 5.66 percent and health at 1.34 percent. Housing, water, electricity, gas and other fuels sit at 2.61 percent, and restaurants and accommodation at 8.38 percent. A village household that spends mostly on food and a metro household that spends mostly on rent are measured by the same index. Each lives with a different inflation rate.
The Consumer Food Price Index, a separate food-only series MoSPI publishes alongside the headline, stood at 5.95 percent in August 2026.
What changed when the base moved from 2012 to 2024?
Three things changed, and they matter when you read an old chart. The weights moved to 2023-24 spending. The item list grew from 299 to 358 weighted items, per Drishti IAS's summary of the PIB release. And rural housing entered the index for the first time.
Because the item basket, the weights and the market coverage all changed, a direct comparison of the new series with the old one is not clean. Year-on-year figures under the 2024 series are comparable only from January 2026, which is why the series printed 2.75 percent for January 2026 as its first figure. MoSPI uses a linking factor, calculated over calendar 2025 when both series ran, to join the two into a long history.
The practical rule for a reader is to check the base year in the footnote. A chart that runs across early 2026 may join two different baskets.
Why does the number matter to an investor's portfolio?
The Reserve Bank of India runs its policy against CPI inflation. The target is 4 percent with a tolerance band of 2 percentage points either side, as the same Drishti summary describes. A CPI print that lands near the top of that band changes the conversation about the repo rate, and the repo rate reaches every holding in a portfolio. The mechanics are in our piece on what a repo rate hike passes through to a portfolio.
The other half of the story is what the number does to money that sits still. Our inflation explainer works through ₹1 crore held for ten years.
The CPI also teaches an investing habit worth copying. It is useful because its basket, its weights and its method are written down, so anyone can rebuild the number and challenge it. Qatobit's QSI indexes follow the same discipline: each index has published allocation weights on its index page and rebalances monthly on a written methodology. The overview is in four crypto indexes, one methodology.
MoSPI publishes each month's CPI on the 12th of the following month, or the next working day if the 12th is a holiday. Read the print against its own table, and read the weights before the headline.
Frequently asked questions
What is CPI inflation in India?
CPI inflation is the year-on-year percentage change in the Consumer Price Index, a weighted basket of 358 goods and services compiled by MoSPI on a 2024=100 base. For August 2026 the provisional all-India figure was 4.82 percent.
Who publishes India's CPI inflation number?
The National Statistics Office under the Ministry of Statistics and Programme Implementation publishes it monthly. In the August 2026 release, MoSPI reported prices collected from 1,407 urban markets and 1,465 villages.
What is the base year of India's CPI?
The base year is 2024, so the index equals 100 for 2024 on average. It replaced the 2012 base, and its weights come from the Household Consumption Expenditure Survey 2023-24.
Why is rural CPI inflation different from urban?
The two groups spend differently, so the same price moves land on different budgets. In the August 2026 release, rural inflation was 5.23 percent and urban was 4.31 percent, against a combined 4.82 percent.
How is CPI inflation calculated from the index?
Divide the current index by the index for the same month a year earlier and subtract one. MoSPI's August 2026 combined index of 108.74 against an implied 103.74 a year earlier gives the 4.82 percent figure.
Crypto investments are subject to market risk. Not financial advice.
“A better allocation begins with a better explanation.”
Qatobit principle
Published construction. Fixed cadence. Versioned control.