The point
The SIP stoppage ratio was 78.53 percent in September 2026: 49.68 lakh plans discontinued or completed against 63.26 lakh new registrations. It sounds like four in five investors quitting, but the ratio only compares two flows in one month and says nothing about why a plan ended. The reason is the part an investor controls, and it is often how the instalment was sized.
What does the SIP stoppage ratio measure?
The SIP stoppage ratio is the number of systematic investment plans discontinued or completed in a month, divided by the number of new plans registered in the same month. A systematic investment plan, or SIP, is a standing instruction that moves a fixed amount into an investment on a schedule. IANS, reporting the Association of Mutual Funds in India (AMFI) data, states the calculation in exactly those terms, on Telangana Today.
For September 2026, the arithmetic is 49.68 lakh divided by 63.26 lakh, which is 0.7853, or 78.53 percent. In August the same sum was 53.82 lakh divided by 66.40 lakh, or 81.05 percent. Both sets of figures are reported by Angel One, citing AMFI.
The ratio has now fallen five months in a row. It stood at 95.46 percent in May 2026 and 76.27 percent in September 2025, per the same report.
Does a 78 percent ratio mean most investors quit?
No, and AMFI's own caveat says so. As IANS reports it, the ratio should not be read as the percentage of existing investors who stopped investing, because the count includes plans that finished their scheduled tenure.
Two more things sit inside the number. An investor who closes one SIP and opens another in a different scheme appears once on each side. And the ratio divides a month's endings by that same month's beginnings, so it never touches the stock of plans already running.
Put the stock beside the flow. Angel One reports 10.06 crore contributing SIP accounts, which is 1,006 lakh. The 49.68 lakh endings in September are about 4.9 percent of that. This is rough arithmetic, because accounts and registrations are counted differently. It is still the better picture: roughly one plan in twenty ended in a month the ratio makes look like four in five.
What does a falling ratio say, and what does it miss?
It says that endings fell faster than beginnings. In September, endings dropped from 53.82 lakh to 49.68 lakh, a fall of 4.14 lakh. New registrations dropped from 66.40 lakh to 63.26 lakh, a fall of 3.14 lakh, or 4.7 percent. The ratio improved because closures shrank by more, and sign-ups did not rise.
Monthly SIP inflows reached ₹32,490 crore, up from ₹32,297 crore in August and from ₹29,361 crore in September 2025, according to the same reports.
What it misses is every reason. AMFI publishes counts, and a count has no motive attached. Whether a plan stopped because the market fell, because the investor needed the cash, because a goal was reached or because a better scheme appeared is not in the data. Anyone who tells you why the ratio moved is offering a view. This piece offers one too, and labels it.
Why do SIPs stop? The view this piece argues
The view: a large share of the SIPs that stop were sized for the investor's best month and not for the worst one. The ratio is closer to a sizing statistic than a sentiment statistic. This is an argument, since no public dataset records the reason.
The common view says people stop SIPs when markets fall. Some do. A fall is loud and makes a good story. What drains an account is a month with a tax payment, a school fee, a repair or a delayed receivable. An instalment that was comfortable in an average month becomes the first item to cut in a bad one. A stopped SIP is hard to restart with the same enthusiasm.
Sizing to the best month
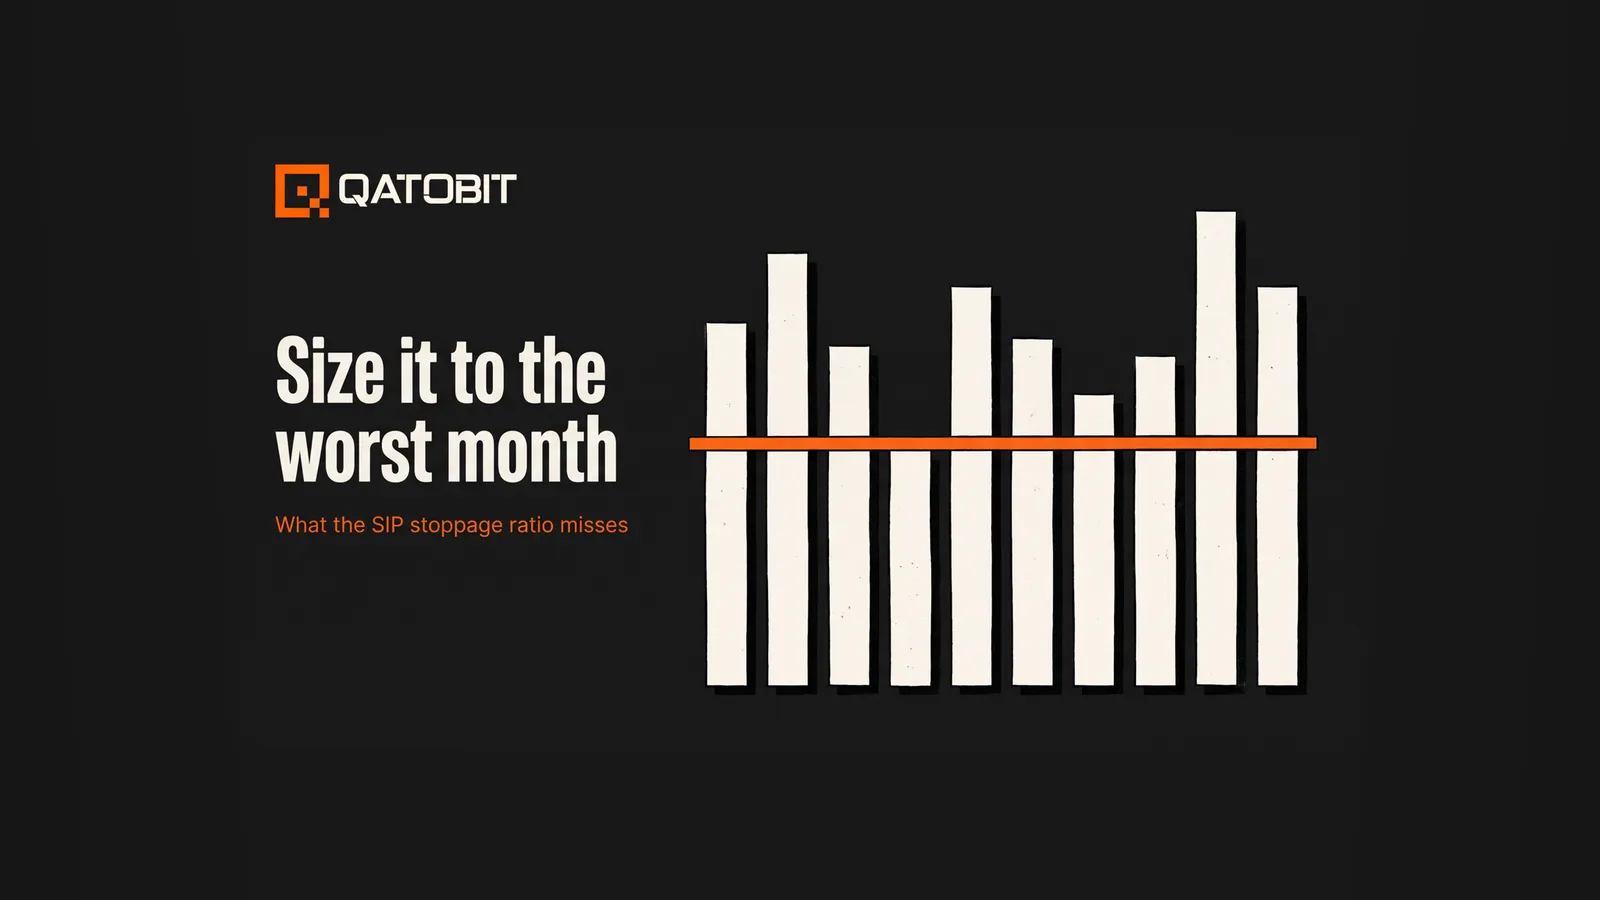
Take an investor whose monthly surplus, after fixed costs, runs between ₹30,000 and ₹80,000 across a year. The average is ₹55,000. An instalment of ₹55,000 looks reasonable on that average. In a ₹30,000 month it is ₹25,000 more than the surplus, and something has to give. Usually the SIP gives.
Sizing to the worst month
Set the instalment against the worst month instead. Here the worst surplus is ₹30,000. An instalment of ₹20,000 is 67 percent of it and leaves ₹10,000 of room. Over twelve months, ₹20,000 a month is ₹2,40,000 invested, and every month leaves the investor room for the plan and everything else.
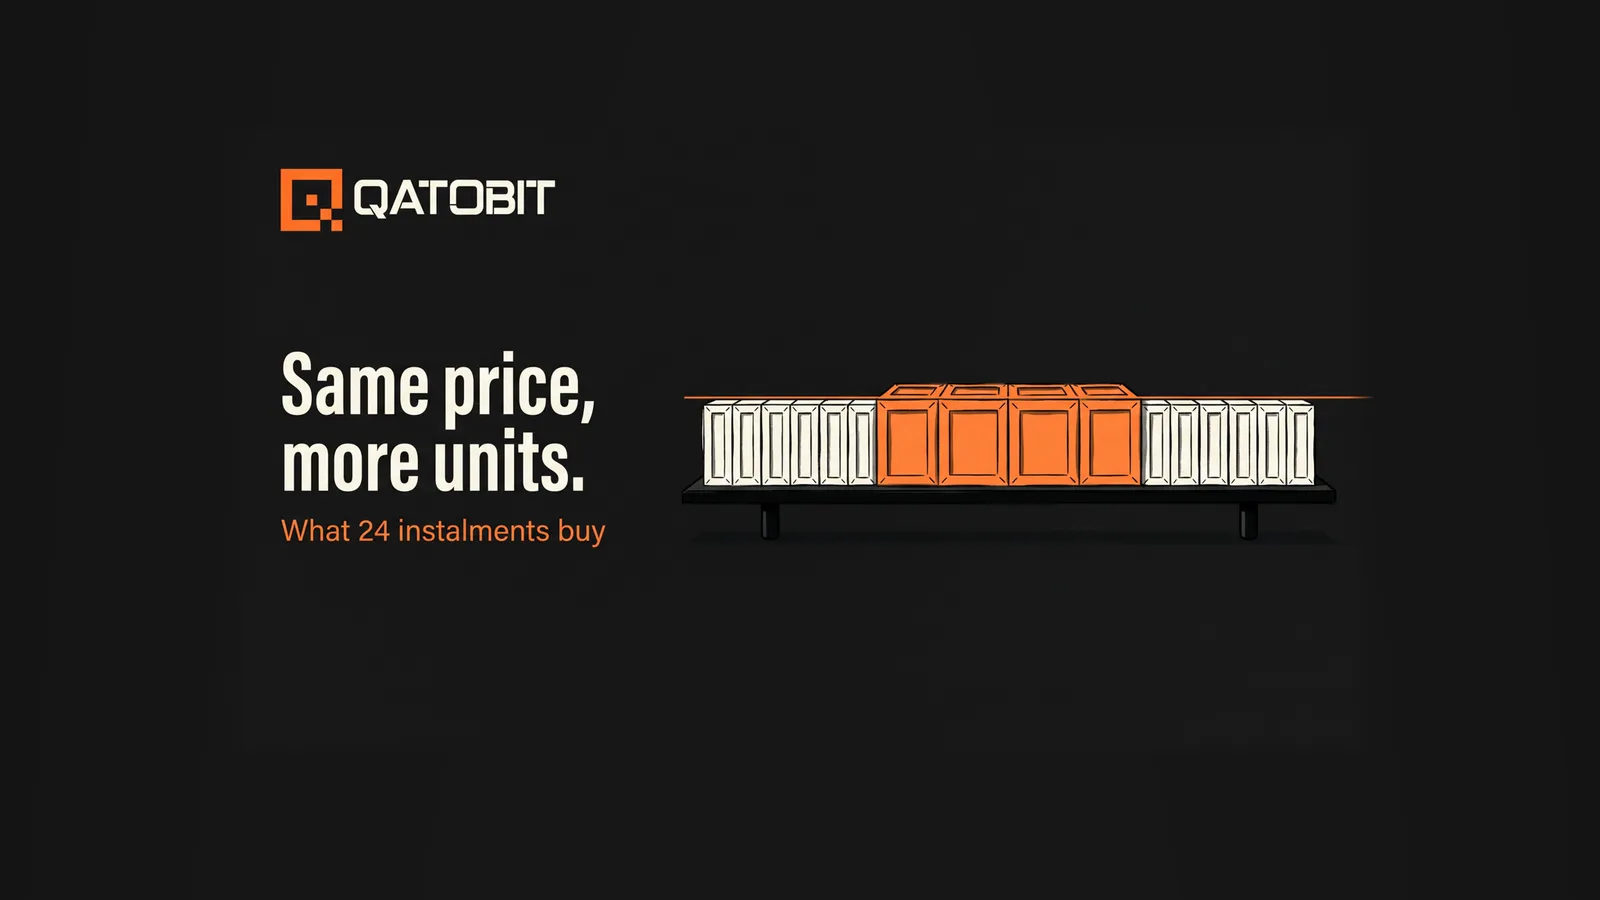
The smaller number looks like a lower ambition, yet it is the one that completes. A plan that runs for twelve years at ₹20,000 invests ₹28,80,000 (₹20,000 × 144 months). A plan set at ₹55,000 that stops in month fourteen invests ₹7,70,000 (₹55,000 × 14 months) and then nothing.
Raising the instalment later
A SIP can be raised, and raising it later works better than starting high. Set the floor against the worst month, then step it up when the surplus has shown, over several months, that it can carry more. A step-up rests on months of evidence, while a starting figure sized to the best month rests on hope.
How to size an instalment so it survives
Run this check once, before the SIP starts, and again whenever income changes.
- List the last twelve months of surplus after fixed costs. Fixed costs include rent or EMIs, insurance premiums, taxes due and any standing family commitments.
- Find the lowest month. Ignore the average.
- Set the instalment at no more than two thirds of that lowest month. On a ₹30,000 low, that is ₹20,000.
- Decide in advance what raises it: three consecutive months where the surplus ran above the instalment by a stated margin, for instance.
- Decide in advance what pauses it, so a pause follows a rule you set beforehand.
A written rule outlasts a bad month because the decision was taken in a calm one, whatever the asset.
What changes when the asset is crypto?
The sizing logic is the same, and the asset's volatility makes it matter more. Crypto prices move sharply in both directions, and the market carries risk. An instalment that would be uncomfortable in a ₹30,000 month becomes harder to keep when the value of the holding is also falling. Sizing to the worst month takes one source of pressure out of the decision, so only the price is left to deal with.
At Qatobit, a Crypto SIP lets you set an amount, a cadence of weekly, biweekly or monthly, and an asset, and the platform invests from your INR balance on schedule. You can start a Bitcoin SIP, an Ethereum SIP or a Solana SIP. A SIP into a QSI Crypto Index spreads each cycle across a whole basket on a published methodology. Rupee cost averaging smooths timing risk through cadence-based averaging, and market risk remains.
A SIP and a lump sum ask different things of you, set out in SIP vs lump sum comes down to timing and nerve. If the price ends a run of instalments where it started, SIP returns when the price ends where it started walks through what the instalments did. What a QSI index holds and how it is rebalanced is covered in what a crypto index is. AMFI publishes the monthly series the ratio comes from at AMFI Monthly, read 2026-10-14.
What to take from the number
The ratio will keep moving, and each move will get a headline about investor mood. Nobody controls the market or the count of plans AMFI records. Your own instalment is the part within reach, and it can be set for the month you are least able to afford it. Set it there, and the ratio becomes someone else's statistic.
Frequently asked questions
What is the SIP stoppage ratio?
It is the number of SIPs discontinued or completed in a month divided by the number of new SIPs registered that month. For September 2026, AMFI data reported by Angel One gives 49.68 lakh divided by 63.26 lakh, or 78.53 percent.
Is a high stoppage ratio bad?
Not by itself. The count includes SIPs that reached the end of their scheduled tenure, and it includes investors who close one plan to open another. A high ratio does not mean that many investors lost their nerve.
Is the SIP stoppage ratio the share of investors who stopped investing?
No. IANS reports that it should not be read that way, because AMFI's figures include completed plans. It compares one month's endings with that month's new registrations, not with the plans already running.
How should I size a SIP instalment?
Against your worst month of surplus after fixed costs, and not your average. A common check is to keep the instalment at no more than two thirds of that lowest month, then raise it when several months show the surplus can carry more.
Does a Crypto SIP carry the same sizing logic?
Yes. A weekly, biweekly or monthly instalment into an asset such as Bitcoin still draws on your cash flow, so it should be sized to the worst month.
Crypto investments are subject to market risk. Not financial advice.
“A better allocation begins with a better explanation.”
Qatobit principle
Published construction. Fixed cadence. Versioned control.